Debugging code, sometimes painful, sometimes funny, but always an exciting task.

If we don’t use the right tools, It’s where the developer can waste more time. Making debugging easy for developers has been sometimes a problem for technology, but fortunately, in Python, there have been good debug options right from the start.
Visual Studio Code has a very powerful and configurable tab where you can define the desired configuration for your project. You can have all the configurations you want! (for testing, debugging, running a specific process…)
TL;DR
From VS Code, we can easily debug Python code locally but also when running inside of a Docker container using ptvsd. I’ll tell you how.
We all have printed code at some point of our career, but the path to becoming a better developer goes beyond that, it’s essential to spend time researching until we find better tools for the task.
Printing has never been cool, but before learning the proper debugging tools, it has always been that quick and dirty option to check variable output.
PDB
PDB and pudb are great tools! I still use them sometimes when I want to debug something tricky, but for debugging speed purposes I find much more convenient using VS Code Debug tab, where I can see all the context on a specific line of code.
Before that, I used to have a snippet for pdb, and that would extend to import pdb; pdb.set_trace() so I could stop the execution at a specific line of code. Then with (n)ext, (c)ontinue, (q)uit… I could control the execution line by line and step into a specific function or method (more on pdb and pudb).
VS Code
After a while using VS Code I started getting deep into different user and workspace configurations on Django and Node/React, this article gives an example on how we could configure a Django project to use the VS Code debugging tab.
Starting services having installed a Django project locally is easy, we could just use runserver. We’d click the Debug tab, select Add configuration... in the selector and follow the wizard selecting Django: runserver.
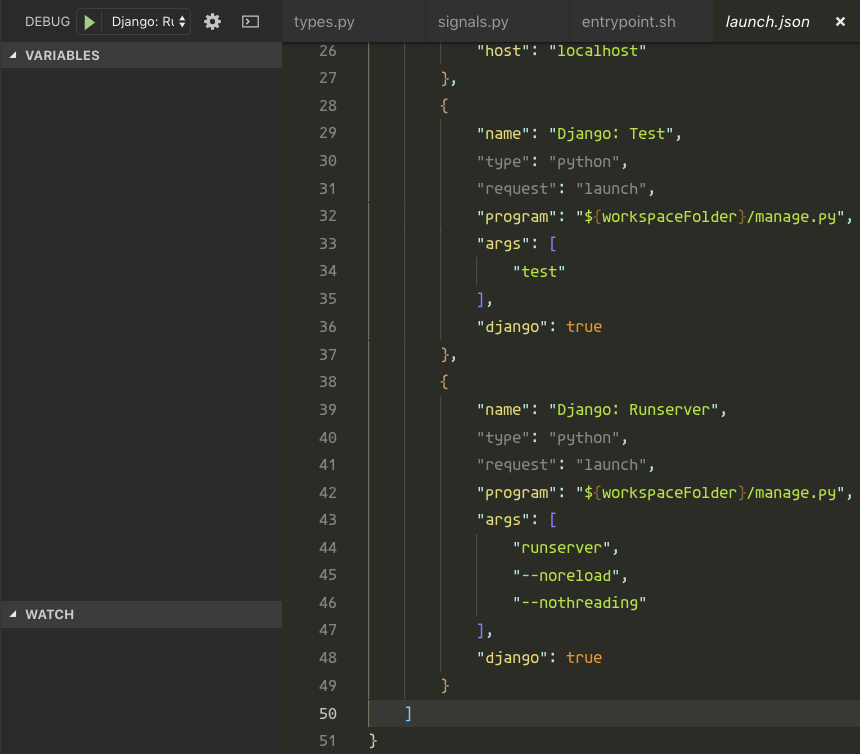
The configuration would look like this:
{
    "name": "Django: Runserver",
    "type": "python",
    "request": "launch",
    "program": "${workspaceFolder}/manage.py",
    "args": [
        "runserver",
        "--noreload",
        "--nothreading"
    ],
    "django": true
}
If you use pipenv, virtualenv or have selected the pythonPath on your workspace configuration (Command-, on Mac), VS Code knows how to run the command automatically. We could have a command for testing too, having an envvar to select another DJANGO_SETTINGS_MODULE.
{
    "name": "Django: Test",
    "type": "python",
    "request": "launch",
    "program": "${workspaceFolder}/manage.py",
    "env": {"DJANGO_SETTINGS_MODULE": "myproject.settings.test"},
    "args": [
        "test"
    ],
    "django": true
}
We’d click play and have our tests passed. :-)
VS Code debug in Docker
Debugging inside a Docker container is a bit trickier, we need to open a socket so we can debug from VS Code, let’s see how.
Our Django Dockerfile looks something like this if we use pipenv.
FROM python:3.7

RUN mkdir /code

WORKDIR /code

RUN pip install pipenv
ADD Pipfile /code/
RUN pipenv install --dev

COPY . /code/

EXPOSE 8000
We could have a docker-compose.yml file to manage dependencies easier, such as postgres, redis, or just the ports opened for the host.
version: '3.7'

services:
  db:
    ...

  backend:
    build: .
    image: mydjangoproject
    command: pipenv run manage.py runserver 0.0.0.0:8000
    environment:
      DJANGO_DEBUG: 1
      DJANGO_SETTINGS_MODULE: myproject.settings.local
    volumes:
      - .:/code
    ports:
      - 8000:8000  # Serving Django
      - 8888:8888  # debugging service (ptvsd)
    depends_on:
      - db

  frontend:
    ...
In this case, we open the 8000 for Django runserver and the 8888 so VS Code can connect via the Debug tab to Django.
To be able to do this, Microsoft created a library, ptvsd the Python tools for the Visual Studio debugger. This library runs within our Python code and opens a socket we can connect to debug the application. In Django, we can put it on the wsgi.py file and It will only run if settings.DEBUG is True.
import os

from django.core.wsgi import get_wsgi_application


os.environ.setdefault("DJANGO_SETTINGS_MODULE", "myproject.settings")

if os.environ.get('DJANGO_DEBUG', False):  # You can use django.conf settings.DEBUG
    import ptvsd
    ptvsd.enable_attach(address=('0.0.0.0', 8888))
    ptvsd.wait_for_attach()  # We can remove this line it gives you trouble,
                             # but it's good to know if the debugger started or not
                             # blocking the execution for a while :-)

application = get_wsgi_application()
We open the socket to the outside world 0.0.0.0 in the port 8888 so we can connect from the host, our machine.
We execute our docker-compose script, in my case docker-compose up backend.
In VS Code the configuration would be pretty straight forward, we add the port where ptvsd opened the socket, we tell VS Code,
our localRoot is the current project and the remoteRoot which is my /code path, defined on my Dockerfile for this project.
{
    "name": "Remote Django App",
    "type": "python",
    "request": "attach",
    "pathMappings": [
        {
            "localRoot": "${workspaceFolder}",
            "remoteRoot": "/code"
        }
    ],
    "port": 8888,
    "host": "localhost"
}
Now It’s when the magic happens! You should be able to do something like this. :-)
Do you know more tricks debugging on VS Code? Let me know in the comments!